Vapor Phase Epitaxy
Device Physics Laboratory
Understanding surface structures is one of the fundamental issues in epitaxial growth. Reflection high energy electron diffraction is routinely used in molecular beam epitaxy (MBE). In metalorganic vapor phase epitaxy (MOVPE), optical tools, such as reflectance difference spectroscopy (RDS) and surface photoabsorption (SPA), are used. However, surface structures in MOVPE growth are still uncertain because of the low spatial resolution owing to the longer wavelength of visible light.
A crystallographic structure analysis by using x-ray diffraction is known as a powerful tool for determining the atomic arrangement in bulk crystals, and has also been applied in analyses of surface structures in liquid and gaseous environments. Additionally, owing to the low interference between x-rays and materials, a quantitative treatment of measurement is possible, and this makes the analysis procedure easier. To investigate fundamentals of epitaxial growth in the gas phase, we developed an in situ x-ray diffractometer that combines an x-ray goniometer and reactor chamber [1], and used it to analyze surface structures of indium phosphide (InP) [2].
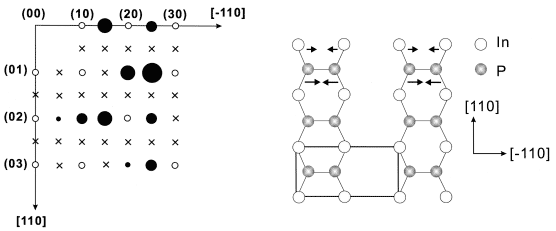
Due to high partial pressure of V-elements, it is difficult to obtain good-quality epitaxial films in MBE, and surface structures in the growth environment are poorly understood. We investigated InP (001) surfaces grown by MOVPE in a hydrogen environment. Figure 1 shows intensity distribution of a reconstructed InP (001) surface in reciprocal space. Filled symbols show the points where Bragg diffraction was observed, and crosses show where there were no diffraction. Open circles indicate points where we cannot observe Bragg diffractions because of the bulk Bragg diffraction. Obviously, fractional diffractions of (1/2 n) along the [-110] direction and integral diffraction spots along the [110] direction were observed, suggesting (2X1) periodicity on the surface. Additionally, intensity variation along (1/2 m), (3/2 m) was observed, suggesting the surface model shown in Fig. 2.
[1] T. Kawamura et al., J. Cryst. Growth 221 (2000) 106.
[2] T. Kawamura et al., Appl. Phys. Lett. 77 (2000) 996.
|
|