Device Physics Laboratory
Å@Thinning resist film is an effective way to prevent resist pattern collapse and improve resolution. However, the characteristics of ultra-thin resist film, 100-nm thick or less, should strongly reflect surface and interface effects. They should be different from those of conventional thick resist films and affect the roughness, which is the resolution determining factor of resist patterns. Thus, an understanding of the thinning effect on resist performance is important in high-resolution nanolithography. We have, therefore, clarified quantitatively the resist thinning effect on the roughness and resist internal structure [1].
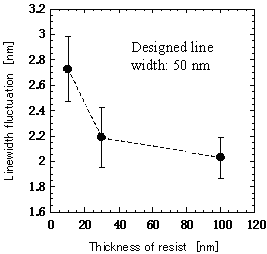
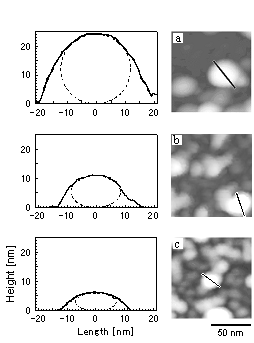
Å@Ultrathin resist films (ZEP520) (10-, 30-, and 100-nm thick) were investigated by using an atomic force microscope (AFM). Roughness at each thickness was compared by linewidth fluctuations of delineated line patterns (designed line width of 50 nm). It was found that the linewidth fluctuation increased with decreasing resist thickness as shown in Fig. 1. There was a marked increase below 30 nm. To determine the cause of the increase, we investigated the thinning effect on the resist internal structure by focusing on the polymer aggregates. The results are illustrated in Fig. 2. The aggregates appeared to be compressed and their volume seemed to decrease with decreasing resist thickness. Owing to those change of internal structure, the dissolubility increased with decreasing resist thickness. This indicates that the surrounding polymers dissolve faster when the aggregate becomes compressed. Hence, the dissolubility contrast between the polymer aggregates and surroundings is enhanced by thinning, thus probably causing the increase of roughness. This study suggests that decreasing the dissolubility contrast is important for high-resolution nanolithography using ultra-thin resist film.
[1] K. Kanzaki et al., Jpn. J. Appl. Phys. 41 (2002) L1342.
 |
 |
||||
|
|