Optical Science Laboratory
Coherent phonons are the in-phase lattice vibrations driven by the ultrashort
laser pulses whose duration is shorter than the oscillatory period. In
contrast to frequency-domain approaches, such as Raman spectroscopy or
infrared-active spectroscopy, the observation of coherent phonons provides
time-domain information about the lattice vibrations.
For Si, which is the fundamental semiconductor, the Raman spectrum is
modified by p-type doping, reflecting the asymmetric shape of the valence
band in k-space [1]. To study the electron-phonon dynamics dominated by the asymmetry
in the carrier distribution, we have observed coherent phonons in p-type
Si [2].
We performed time-resolved reflectivity measurements with a sub-10-fs Ti:sapphire
oscillator at a center wavelength of 780 nm. Samples were non-doped Si
and p-type Si. The carrier concentration in the p-type Si was 3×10¹⁹-1.5×10²⁰ /cm3.
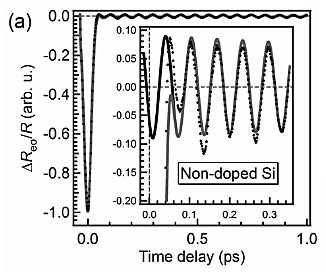
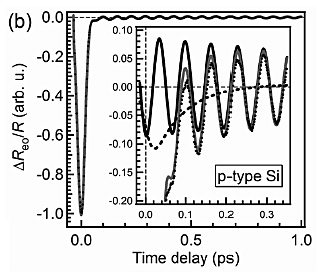
The time-resolved reflectivity changes for non-doped Si and the p-type
Si are shown in Figs. 1(a) and (b), respectively. The oscillatory signal,
originating from coherent phonons in Si, is observed after an overlap between
the pump and probe pulses at t=0. In the p-type Si, the decay from the photo-generated carriers, which
distribute anisotropically in k-space (i.e., anisotropic state-filling), is observed as shown by the dotted line in Fig. 1(b). In the p-type Si, the Fermi level is lowered in the valence band with the non-parabolic structure, which causes the anisotropic hole distribution [2]. When the oscillatory signal is fitted with cos(ω0t + φ), where ω0 and φ correspond to the frequency and initial phase of the coherent phonons,
respectively, the initial phase in the p-type Si is shifted to the cosine
phase with the anisotropy in the hole distribution.
This research was supported by KAKENHI.
[1] F. Cerdeira, T. A. Fjeldly, and M. Cardona, Phys. Rev. B 8 (1973) 4734.
[2] K. Kato, A. Ishizawa, K. Oguri, K. Tateno, T. Tawara, H. Gotoh, and
H. Nakano, Jpn. J. Appl. Phys. 48 (2009) 100205.
  |
||
|