Materials Science Laboratory, *Suzuka Nat. Coll. Tech.
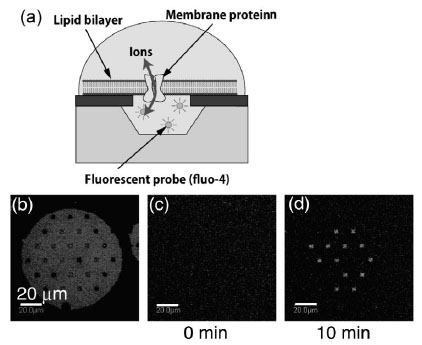
For the functional analysis of ion channel activity, an artificial lipid
bilayer suspended over microwells was formed that ruptured giant unilamellar
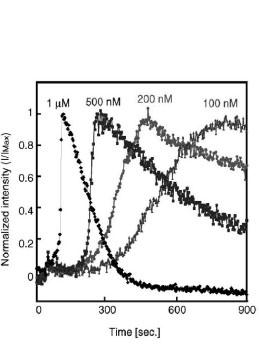
vesicles on a Si substrate. Ca2+ ion indicators (fluo-4) were confined in the microwells by sealing the microwells with a lipid bilayer as shown in Fig. 1. An overhang formed at the microwells prevented the lipid membrane from falling into them and allowed the stable confinement of the fluorescent probes. The transport of Ca2+ ions through channels formed by α-hemolysin inserted in a lipid membrane was analyzed by employing the fluorescence intensity change of fluo-4 in the microwells [1]. The insertion of α-hemolysin into a suspended lipid membrane and the formation of nanopores induce the transport of Ca2+ ions, and the fluorescence intensity of fluo-4 increased as a result. When the α-hemolysin concentration is higher, the fluorescence intensity should reach its maximum value earlier as shown in Fig. 2.
The microwell volume was very small (1〜100 femtoliters), so a highly sensitive
monitor could be realized. The detection limit is several tens of ions/sec/µm2, and this is much smaller than the ion current in a standard electrophysiological
measurement. Smaller microwells will make it possible to mimic a local
ion concentration change in the cells, although the signal to noise ratio
must be further improved for the functional analysis of a single channel.
We demonstrated that a microwell array with confined fluorescent probes
sealed by a lipid bilayer could constitute a basic component of a highly
sensitive biosensor array that works with functional membrane proteins.
This array will allow us to realize parallel testing devices with a high
throughput.
[1] K. Sumitomo et al., Biosensors and Bioelectronics 31 (2012) 445.
 |
 |
|||||
|
|