Optical Science Laboratory
Ultra-cold atoms manipulated by electromagnetic field
have been used widely for the applications of quantum information processing
and quantum metrology. As a promising quantum device for full quantum control
of an atomic state, a persistent-supercurrent atom chip allows us to trap
atoms in extremely stable and tight potential. So far we have trapped atoms
in a magnetic field of the persistent-supercurrent atom chip [1, 2]. In
this year, we achieved 87Rb Bose-Einstein condensate (BEC) by radio frequency induced evaporative
cooling. This result paves the way for the development of quantum devices
such as quantum memories and atom interferometers.
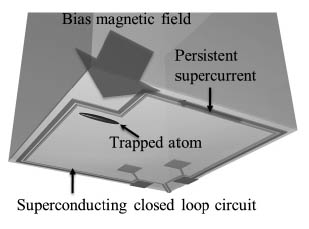
As shown in Fig. 1, Rb atoms were trapped in a potential
generated by the magnetic field of a persistent supercurrent in a closed
loop circuit and a bias magnetic field. To verify the condensation, we
employed the time-of flight (TOF) imaging technique, and measured the momentum
distribution of atoms released from the trapping potential after the evaporative
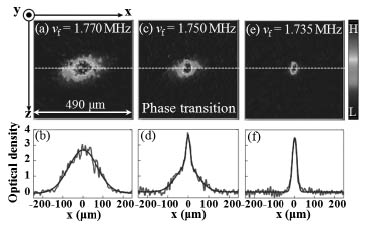
cooling. Figure 2 (a) and (b) show the TOF image after 15 ms and the cross-section
along the dotted line. These images were taken when a final radio frequency
of the evaporative cooling vf was 1.770 MHz. The broad distribution indicates that the atomic gas remained
in the thermal state. In Fig. 2 (c) and (d), a bimodal momentum distribution
was observed as the onset of the BEC transition at vf = 1.750 MHz. When vf was further decreased to 1.735 MHz [Figure 2 (e) and (f)], the thermal distribution was not observed and an almost pure condensate with a narrow distribution was obtained.
This work was supported by FIRST program, KAKENHI, and
JST-CREST.
[1] T. Mukai et al., Phys. Rev. Lett. 98 (2007) 260407.
[2] C. Hufnagel et al., Phys. Rev. A 79 (2009) 053641.
 |
 |
|||||
|
|