Evaluation of Disorder Introduced by Electrolyte Gating through Transport Measurements in Graphene
Owing to the large capacitance as well as the flexibility, transparency, and facile processing of ionic liquids, electrolyte gating has been used for widespread applications. However its drawback, namely contamination of the surface of the base material, has been overlooked. In this work, we evaluate the degree of disorder introduced by the electrolyte gating structure using graphene, in which the carrier transport is sensitive to disorder scattering [1].
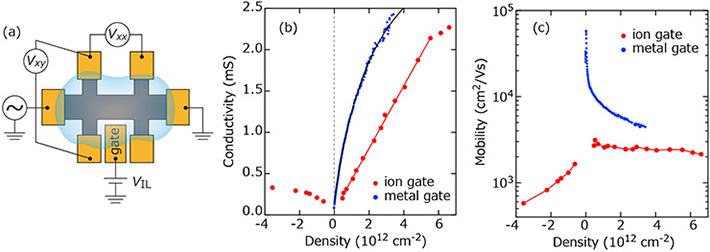
We used graphene grown by thermal decomposition of a 6H-SiC(0001) substrate. Two different types of samples were fabricated; one using an ionic liquid gate and the other having a metal gate for reference. For the ion-gated samples, the graphene Hall bar and coplanar Cr/Au gate electrode were coated by EMIM-TFSI [Fig. 1(a)]. To quantitatively investigate the disorder effects from the ionic liquid, we compare the transport properties for the ion- and metal-gated samples through a wide range of the carrier densities. From the slope of the conductivity as a function of the carrier density, we found that the deposition of the ionic liquid introduces charged impurities with a density of approximately 6 × 1012 cm–2 [Fig. 1(b)]. This limits the low-temperature mobility of graphene to 3 × 103 cm2/Vs [Fig. 1(c)]. We also found that at higher temperature (> 50 K), phonons in the ionic liquid further reduce the mobility; restricting the upper limit at room temperature to approximately 2 × 103 cm2/Vs at room temperature. Since the degree of disorder does not depend on the base material, our results provide useful information on estimating the disorder effects in any type of electrolyte gating experiments.
- [1] A. Browning et al., Appl. Phys. Express 9, 065102 (2016).
|
| Fig. 1. (a) Schematic top view of the ion-gated sample. (b) and (c) Conductivity and mobility, respectively, as a function of the carrier density at 4 K for the ion-gated sample (red dots) and metal-gated sample (blue dots). The solid lines in (b) represent results of the fitting. |