Optical Science Laboratory
Ultracold atoms have been stimulating many researchers’ interest after
a successful realization of Bose-Einstein condensation in 1995. Recent
noteworthy progress on atom manipulation techniques has led to unprecedented
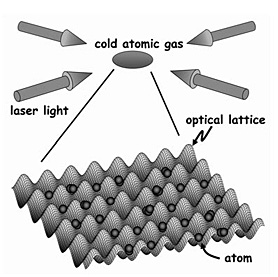
experiments demonstrating an extremely high controllability. An optical
lattice, formed by a standing wave of counter-propagating laser lights
as shown in Fig. 1, is a typical example that allows us to investigate
fundamental quantum many-body problems found in condensed matter physics
via atomic gases.
We have developed a highly efficient numerical method based on the Gutzwiller
approximation and analyzed the ground state properties of ultracold atoms
trapped in optical lattices [1]. To examine the quantitative ability of
our method, we numerically simulated the recent experiment performed by
MIT group [2] which precisely observed the quantum phase transition of
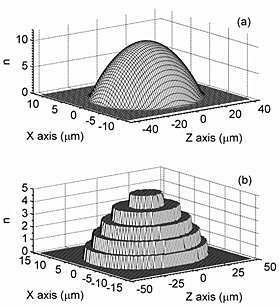
bosonic atoms in a three-dimensional optical lattice. Figure 2(a) shows
the average number distribution of atoms over the lattice sites in the
y=0 plane for the superfluid phase where the depth of optical lattice is
relatively shallow. Note that 560,000 lattice sites and 300,000 atoms are
assumed in our calculations. The smooth and convex atom distribution is
obtained reflecting a weak magnetic confining potential in the experiment.
Figure 2(b), on the other hand, shows the number distribution for the Mott-insulator
phase where the lattice depth is deep enough. Due to the strong repulsive
interactions between the atoms, the average number takes the discrete values
ranging from n=1 to n=5, which leads to a stepwise distribution. From this result, we understand that ultracold atoms in the Mott-insulator phase form an intriguing shell structure in their spatial distribution. The calculated results in Fig. 2 agree well with the experimental observations of MIT group and we have confirmed an excellent quantitative performance of our numerical simulations.
This work was supported in part by Japan Science and Technology Agency, CREST.
[1] M. Yamashita and M. W. Jack, Phys. Rev. A 79 (2009) 023609.
[2] G. K. Campbell et al., Science 313 (2006) 649.
 |
 |
|||||
|
|