Time-lapse Imaging of a Single Neuron During the Early Stages of Apoptosis Using Scanning Ion Conductance Microscopy
It is known that neural morphologies change dynamically during neural network formation. Since the morphological changes are strongly associated with neural functions, it is important to obtain the morphological details of individual neurons. Here, we use scanning ion conductance microscopy (SICM) to describe the series of neural morphological changes that occurs during the early stages of apoptosis, which is well defined as programmed cell death and one of key events in neural network formation [1].
Neurons were prepared from the cortex of a Wistar Rat (18-day embryo) and cultivated on a glass substrate for 8 to 10 days in vitro. Apoptosis was induced by adding staurosporine (STS), whose function is to activate caspase-3, to the culture solution during the SICM observation. Images of apoptotic neurons were obtained every 20 min.
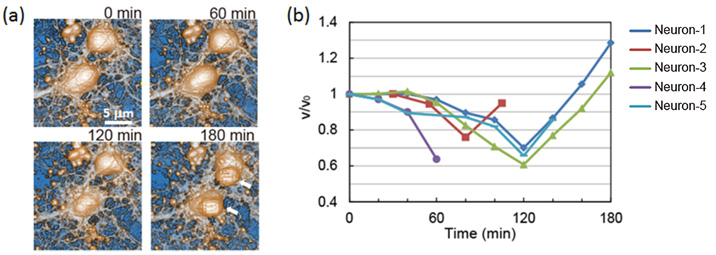
The SICM images show the formation of a spherical shape on the cell surface after the neurons had been exposed to STS for 180 min [Fig. 1(a), white arrows]. This morphological change is similar to blebbing, which is the formation of a bulge in a plasma membrane, caused by decoupling from an underlying cytoskeleton. We performed time-course imaging experiments for five different neurons and thus estimated their volume change over time as a ratio of volume to initial volume, v/v0 [Fig. 1(b)]. The graph shows that the neural volume decreases from 80 to 120 min after exposure to STS, which is known as an apoptotic volume decrease. These results indicate that apoptosis induces a reduction in cellular volume and subsequent membrane blebbing.
This is the first report to use SICM to describe the series of morphological changes ranging from an apoptotic volume decrease to membrane blebbing that occurs during the early stages of apoptosis. In future work, we expect to reveal the relationship between the apoptotic morphological changes and biological events using the simultaneous observation of morphology and conventional live cell imaging equipment such as a fluorescence microscope.
- [1] A. Tanaka, R. Tanaka, N. Kasai, S. Tsukada, T. Okajima, and K. Sumitomo, J. Struct. Biol. 191, 32 (2015).
|
| Fig. 1. Morphological changes in apoptotic neurons induced by STS. (a) Time-lapse SICM images of apoptotic neurons induced by STS. White arrows indicate membrane blebs. (b) Time-course graph of volume change of 5 neurons. The vertical axis is the ratio of volume to the initial volume. v is the neuron volume at each time point, and v0 is the volume at 0 min. |